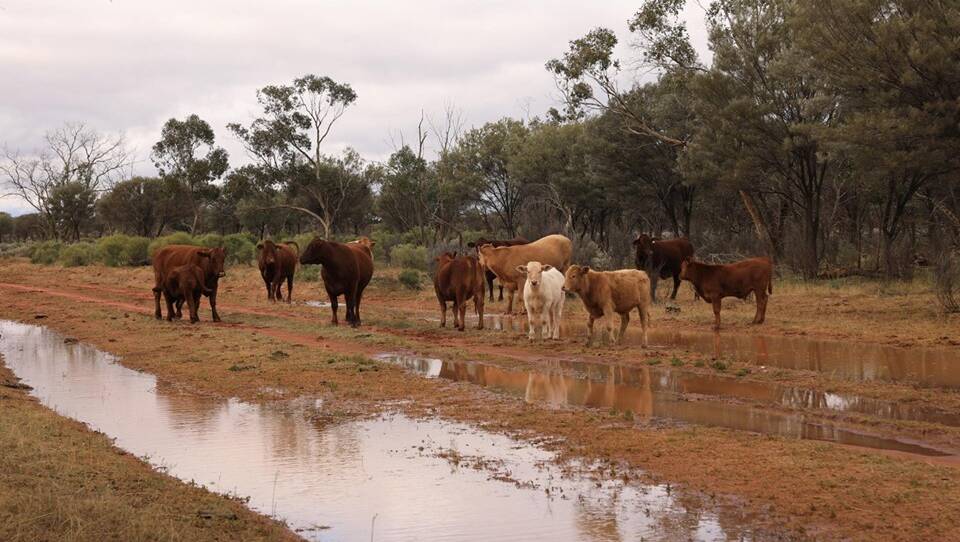
An animation over three years of the State's drought map shows how quickly it took hold - and how consistent rain since February is slowly taking back the dry ground.
The animation of the Combined Drought Indicator (CDI) since 2017 (supplied by the NSW Department of Primary Industries (DPI)) gives a powerful graphic of how the drought fell on all of NSW in an unrelenting way.
It also shows how in the last few months many regions are recovering.
The signs are positive for further good seasonal conditions for the rest of the year, according to the DPI seasonal conditions co-ordinator Scott Wallace.
Mr Wallace said the next six to eight weeks will be critical to see if follow-up rain in the Monaro and South Coast will give longer-term confidence to landholders.
All the signs were positive though, and Mr Wallace says the seasonal change in the south is "significant". Both the North Coast and South Coast were on their way to good spring conditions.
Areas of the state still struggling with the drought include the bulk of the Western Division, (although the Cobar area has received good rain), and cropping areas in the North-West, especially around Moree. Some rain is expected in the area on Friday.
Mr Wallace said most of the agronomic indicators were pointing to a good recovery in conditions.
It would take some time before the impact of the good rain in the south in the last three weeks would be refelected in the pasture growth indicators used by the DPI.
"It's still a fluid situation in many ways, but it's all pointing in the right way."
There had already been a strong rebound on the North Coast, and now the South Coast was looking promising. Also the central areas of the state were getting good follow-up rains.
He agreed that rain had been falling at just the right times since autumn and during the winter to help crops.
Improving soil moisture profiles and getting over rainfall deficiencies was very difficult as most of the state was starting from a very low base. "In central parts of the state we have seen some good improvement over time and it looks like it's going to continue.
"It will be important in the next six to eight weeks to se where that recovery will go from here." All the climate models were pointing to above aveage rainfall.
Anywhere in a line west of Hillston was still looking for rain. Some areas have got kicker feed but that was it.
"All in all I'd have to say the CDI is changing quite significantly (for the better)."
He had observed some unuusal growth over winter including in the Orange district, and frosts events had been kinder.
Matt Lieschke, senior ag advisor South-East Local Land Services, said that moisture probes had for the first time since 2016 picked up moisture at a metre in areas near Goulburn.
"We have seen some good moisture levels down to a metre. Those that were sitting at 60cm are now sensing moisture at 80cm and down to 100cm after the recent rain," Mr Lieschke said.
Pasture forecasters were also picking up moisture at deep levels for much of the Southern Tablelands and now parts of the Monaro.
"It's giving us a positive outlook for pasture growth as we head towards September.
"What has actually been phenomenal is the growth especially around Goulburn that has occurred already. We had good rain early in February and it has been critical to get follow up rain since then and the timing of the rain has been perfect. There's been abnormally high winter growth this year."
Mr Lieschke advised graziers to be mindful of increased spring pasture growth and to watch for too much bulk in paddocks that may decrease the quality of the pasture. He suggested combining mobs to help keep pasture growth lower to improve the quality as spring approached


